How we monitor data in Reco


At Reco, we monitor a lot of data in order to provide our services. But as our user base has grown, we found it increasingly difficult to assure ourselves that our data is of a high enough standard to provide value inside our system.
Yaron Rozen & Liron Ben Haim, software engineers @Reco, set out to show how we created our own monitoring solution at Reco using the tools we already had in place, in order to get the assurance we need.
The problem
Garbage in, garbage out (GIGO) is a very important rule in information systems, the rule states that the quality of information coming out of a system can never be better than the quality of information that was put in. Actionable analytical insights rely heavily, first and foremost, on having clean, structured data.

Photo by Gary Chan on Unsplash
As the Reco platform grows and more customers use it, we found it notably harder to keep track of our data, ensuring that it is clean and of high quality. We work with relational and graph databases, and we wanted to monitor all of them, as well as any future databases we will choose to use.
So we started looking for a solution that will monitor our data quality and alert us in cases of abnormalities and low quality. We need a solution that can be nimble and grow hand in hand with our data platform.
The solution's impact
The solution allows us to monitor changes in the underlying data distribution and enables us to find changes and faults in the data. We can identify whether the distribution of the data coming from a single source was changed and whether an alert was raised about it; we can take a decision to apply changes to our algorithms or not.
Also, as far as data analytics goes, the solution provides a very elegant way of PoCing potential customer-facing features. A data analyst can simply commit a sophisticated query, and rely on the logging client (DataDog in this case) to select a proper visualization, instead of implementing it on their own. This allows them to easily produce a working demo for what could become a dashboard widget in the product later on. This workflow will increase the efficiency and cohesiveness of Research-Product relationships.
Moreover, since the solution is part of the production release cycle, it allows a robust way to query and summarize data online from multiple tenants (k8s namespaces). This eliminates the need to run analytic workflows in each tenant separately, and, in turn, enables research initiatives where the point of view must be global rather than local.
The solution
Basic building blocks: Query, Export, and Monitor
We divided our solution into three parts:
- Query - Gather data from our databases.
- Export - Export the data to a monitoring platform.
- Monitor - Display the data and alert where required.
We’ll present our solution from the last part to the first.
Monitor
Our team uses DataDog as our observability platform, we do not want to use a new platform (or worse, create one) just for our data monitoring tool. DataDog has extensive alerting capabilities and supports building fancy dashboards. So now the question was how to get data into DataDog.
Export
Prometheus to the rescue. DataDog is great, but vendor lock-in isn’t. So, to avoid that, we decided to export the metrics using a standardized format that Datadog (and other platforms) supports. We decided to use the Prometheus format, which integrates with many platforms (DataDog, Prometheus, etc.). Another option was to use the newer openmetrics standard (based on the Prometheus format), but we couldn’t find an appropriate Python client package, and the new standard didn’t offer us significant features.
On the other hand, Prometheus maintains an easy-to-use Python library to export metrics. Currently, we are only using Gauges. Our next question was how to collect the data.
Query
The metrics to be exported are simply the results of queries on these databases, e.g. the number of nodes in our graph database. Querying databases is quite easy, so we just developed this part ourselves.
From YAML to DataDog metrics
Now that we understand our building blocks, we can dive deeper into our solution.
General
Our monitoring service runs on our k8s clusters, and the code is written in Python. The metrics we monitor are declared as configurations in a structure that we defined (Configuration as Code). Because the configurations are injected as configmaps, no image rebuild is needed in order to add a new monitor.
Monitor YAML
As stated above, each of the metrics we monitor is declared as a configuration. In Reco, we use the YAML format as the format for declaring monitors. As an example, here is a YAML of a monitor which counts the number of relationships in our graph database:
name: relationships
description: The number of relationships in Neo4j
db_type: neo4j
query: MATCH (n)-[r]->() RETURN COUNT(r)
This example is quite basic, including a name, description, and information about the database and query.
The full YAML format is defined using pydantic:
class MonitorConfig(pydantic.BaseModel):
   name: str
   description: str
   db_type: DBType
   db_name: Optional[str]
   query: str
   labels: Optional[List[str]] = []
   interval_duration: Optional[timedelta]
Other than the basic fields listed above, some more fields warrant further explanation:
labels- Simple monitors return just one metric (numerical value), but some monitors will return multiple values, one for each row of the resulting query. E.g. a query that returns the number of users in each group (compared to a simple one that returns just the number of users). The labels field is simply the list of the extra fields returned from the query. In the example above it will be the group name.interval_duration- Each monitor can set its own interval time between metric updates, this helps reduce DB load on demanding queries. The format for the time interval is ISO 8601.
A more advanced MonitorConfig YAML will look like this:
name: nodes_per_extraction_source
description: The number of nodes in Neo4j per extraction source
db_type: neo4j
query: MATCH (n) return count(n), n.extraction_source
labels:
- extraction_source
internal_duration: P1D
Query Runners and Controller
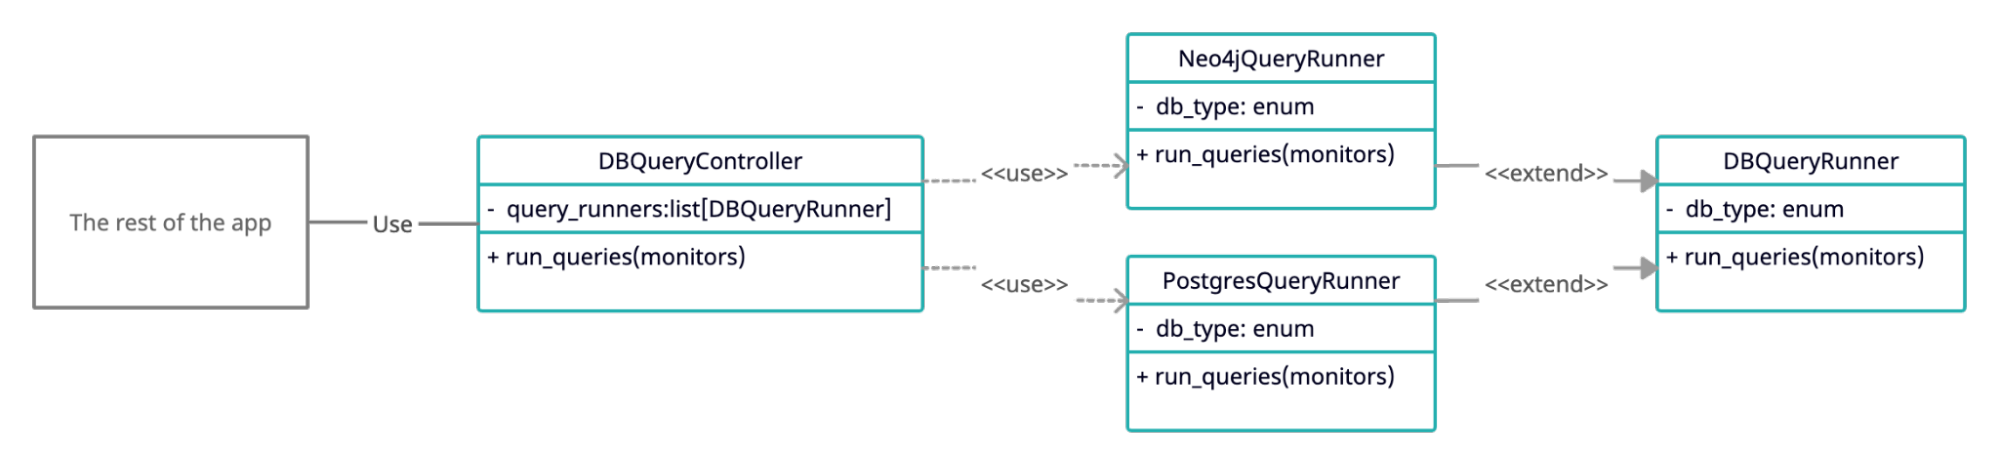
As stated above, we have relational and graph databases, and the monitoring tool needs to gather data from both. We decided to create a DB Controller class to handle all DB connections and export a simple API: Given MonitorConfig to return a QueryResult:
def run_queries(self, monitors_list: List[MonitorConfig]) -> Dict[str, QueryResult]:
  pass # Implementation omitted

def run_query(self, monitor: MonitorConfig) -> QueryResult:
  pass # Implementation omitted
The DB Controller doesn’t interact with the DB directly but holds QueryRunner instances, each responsible for one database. Each QueryRunner class inherits from the base class and needs to:
- Set the
DBType, according to the types in theMonitorConfigdb_type. - Implement the
run_queriesmethod, with the same signature as above.
When the DB Controller gets a list of monitors, it distributes them to the appropriate QueryRunner using the DBType. The following UML diagram shows the connection between the different parts:
Query Result
As seen in the run_queries function signature, each of the queries will result in the QueryResult class, which contains all the required information for the query results. This class is defined by pydantic as well:
class ResultRow(pydantic.BaseModel):
   metric: float
   extra_fields_values: List[str]

class QueryResult(pydantic.BaseModel):
   name: str
   results_rows: List[ResultRow]
   time_of_run: datetime
   failed: bool = False
   run_duration: Optional[timedelta] = None
As well as the name and results of the monitor, that class also contains information about when the result was made and how long it took (the latter is used to monitor DB loads).
Saving Query Result to S3
Some of our queries can be loading on the DB so we want to run them only once in a while (e.g. once a day), and avoid running them if the service restarts for any reason.
By saving QueryResults to S3 we can use the results between service runs. Once queried, each QueryResult is saved into storage, and on startup, the service loads all the latest results and avoids unneeded queries. Saving and loading QueryResults is done easily using pydantic parse_raw() and json() functions.
The service workflow
Once the different parts are understood, the service flow is quite simple:
- Upon startup:
- Load monitor YAMLs from a predetermined directory.
- For each of the monitors:
- Load
QueryResultfrom S3. - Update the monitor’s last result time according to the
QueryResult. - Export the metric using Prometheus exporter.
- Load
- In a loop:
- For each monitor that interval duration has passed:
- Query the DB for the metric using the Query Controller.
- Export the resulting metric using Prometheus exporter.
- Update the monitor’s last result time.
- Save the QueryResult to S3.
- Sleep for a minute. 😴
- For each monitor that interval duration has passed:
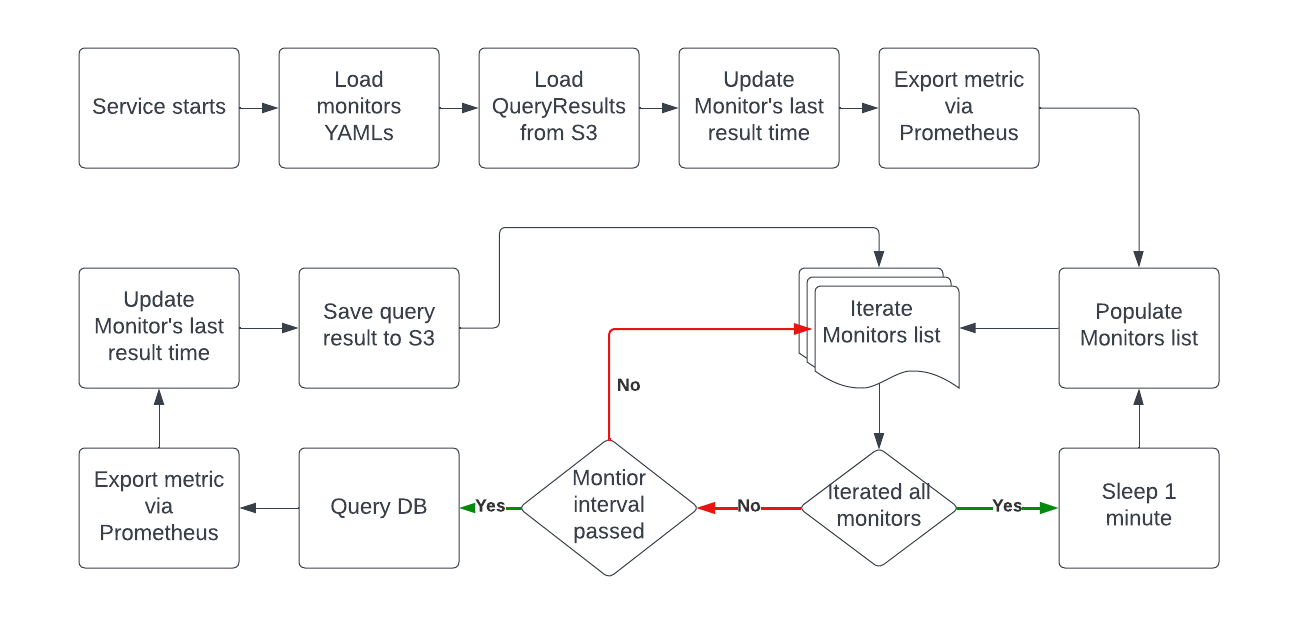
A visual diagram displaying the workflow:
DataDog Scraping
The DataDog agent can scrape for the Prometheus endpoint on k8s pods. We use this functionality to make DataDog detect our Prometheus exporter automatically in all of our k8s clusters.
We added these annotations to our k8s pod to allow auto scraping all of our metrics and adding a prefix of data_monitoring on DataDog:
ad.datadoghq.com/reco-data-monitoring-service.check_names: '["openmetrics"]'
ad.datadoghq.com/reco-data-monitoring-service.init_configs: '[{}]'
ad.datadoghq.com/reco-data-monitoring-service.instances: |-
[
{
"openmetrics_endpoint": "http://%%host%%:%%port%%/metrics",
"namespace": "data_monitoring",
"metrics": [".+"]
}
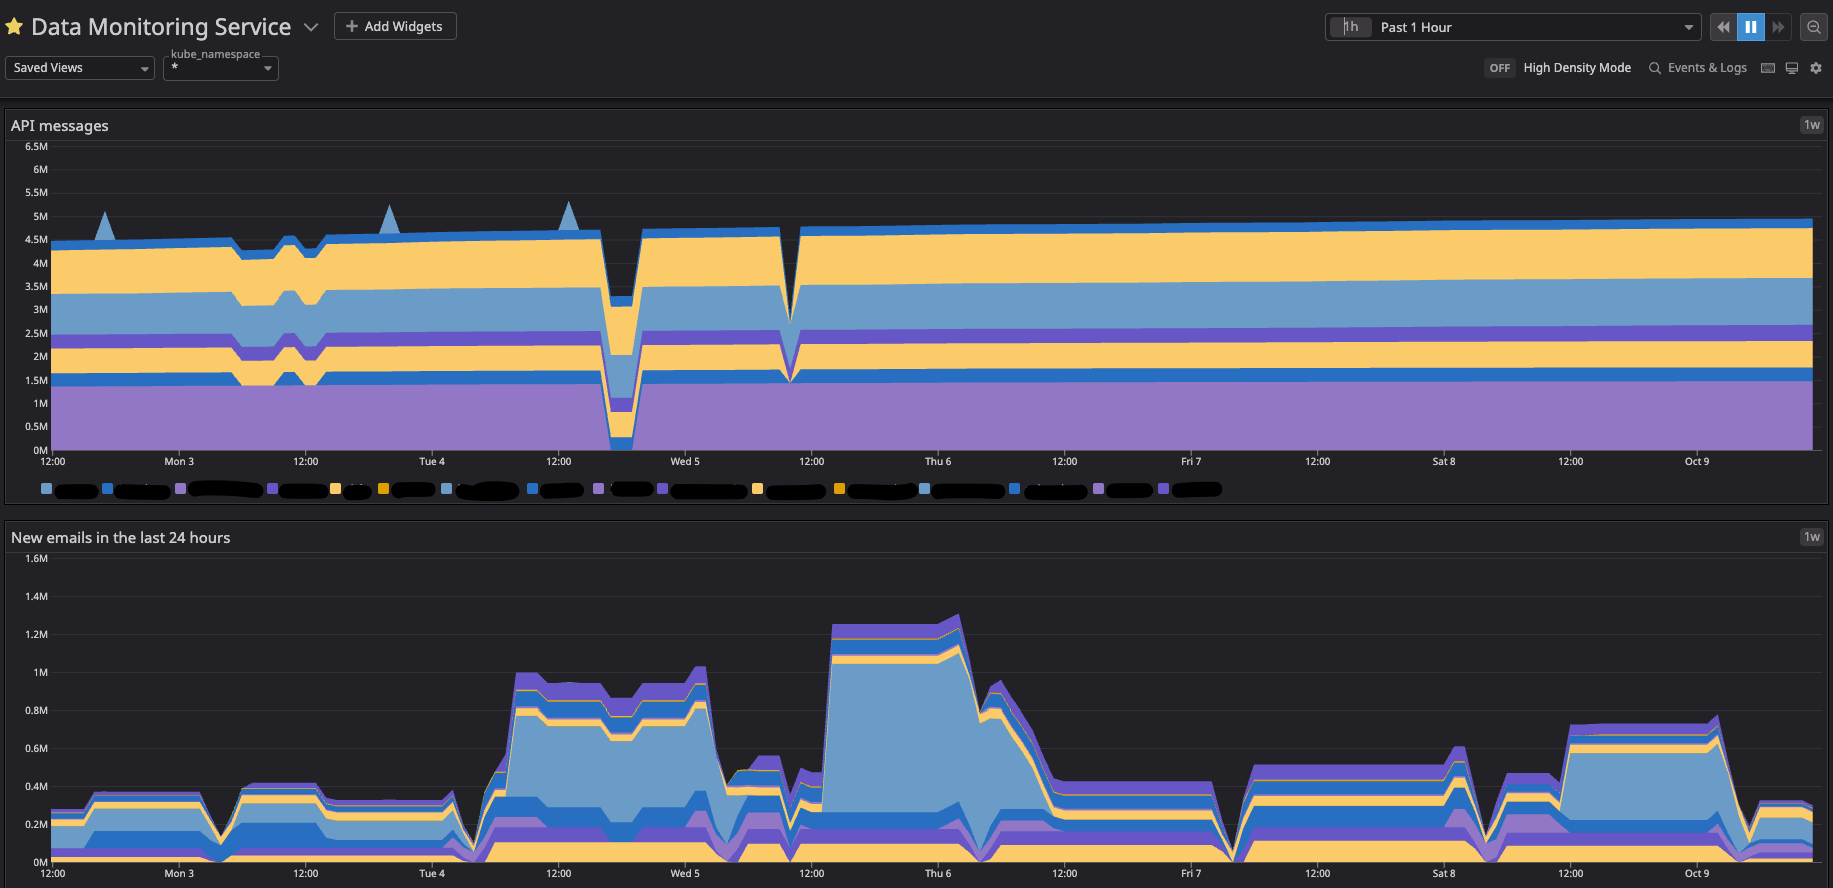
]DataDog presentation
Now that the metrics have been loaded into DataDog we can use them to create alerts and dashboards that give us a general view of the data:
Wrapping it up
Now that the service is up and running, adding a new metric to monitor can be done by simply adding the appropriate YAML file to our YAML directories, all the rest is taken care of by the service.
The impact - which we've described at the beginning of the post - was very positive on the DevEx and product stability! We hope that this blog post will help you improve your data monitoring workflow as well.